Gantner.IQX
IQ-DRIVEN ASSET PERFORMANCE PLATFORM

Real-Time Analytics for Renewable Energy Assets
Powering the Future of Solar & BESS Analytics Gantner.IQX is a vendor-independent SaaS platform for real-time monitoring, analytics and reporting of utility-scale PV power plants and battery energy storage systems. Designed to maximize financial performance and operational transparency across your entire portfolio.
Feature Highlights

Bankable & Vendor-Independent
Seamlessly monitor any hardware from any manufacturer, anywhere in the world
Integrated Asset Management
Keep track of performance, contracts and compliance in one unified platform.
Digital Twin Gantner.MPM
Our mechanistic power model precisely identifies the gap between actual and theoretical production – so you know exactly where yield is lost
Advanced BESS Analytics
Monitor State of Health (SOH) and battery degradation in real time to extend lifetime and protect your investment.
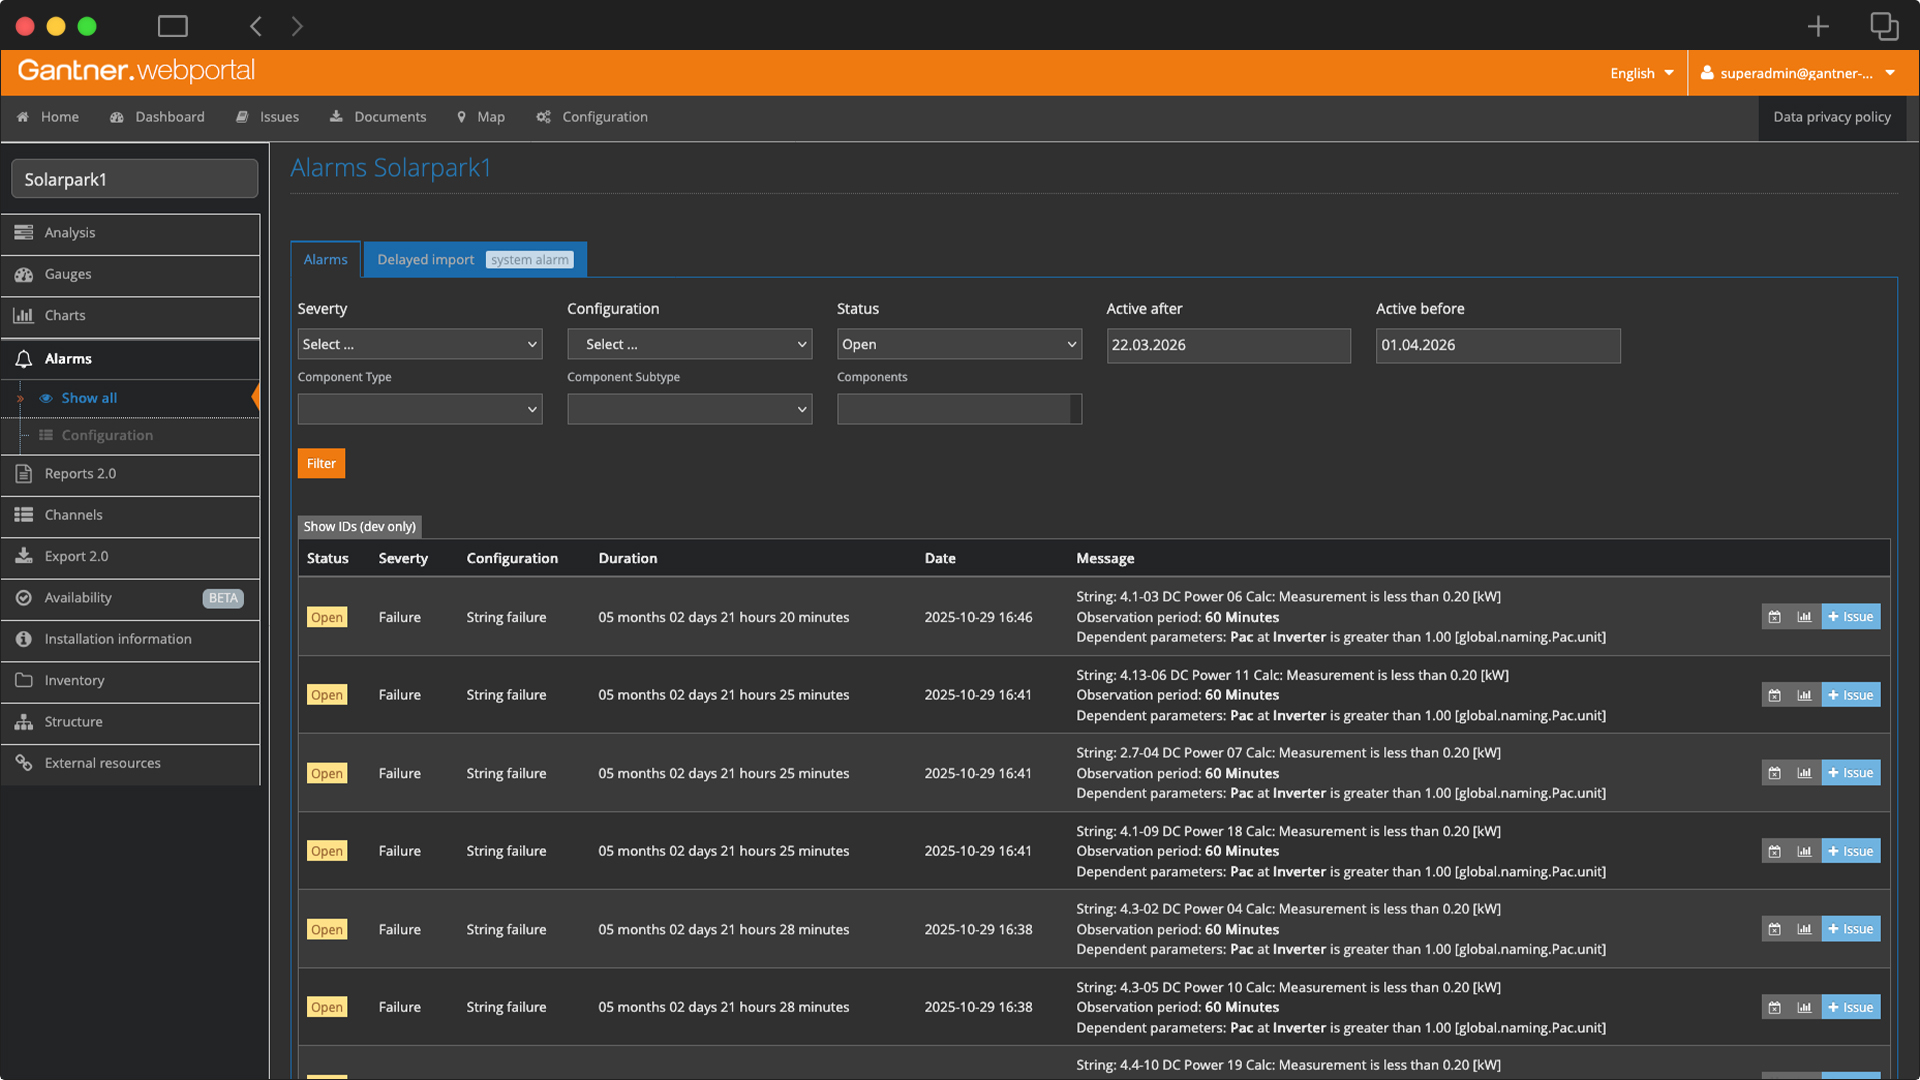
Smart Alarms
Move beyond simple notifications. Issues are automatically prioritized by their financial impact, so your team always focuses on what matters most
Nowcasting & Forecasting
High-accuracy data models predict energy production in real time and ahead of time
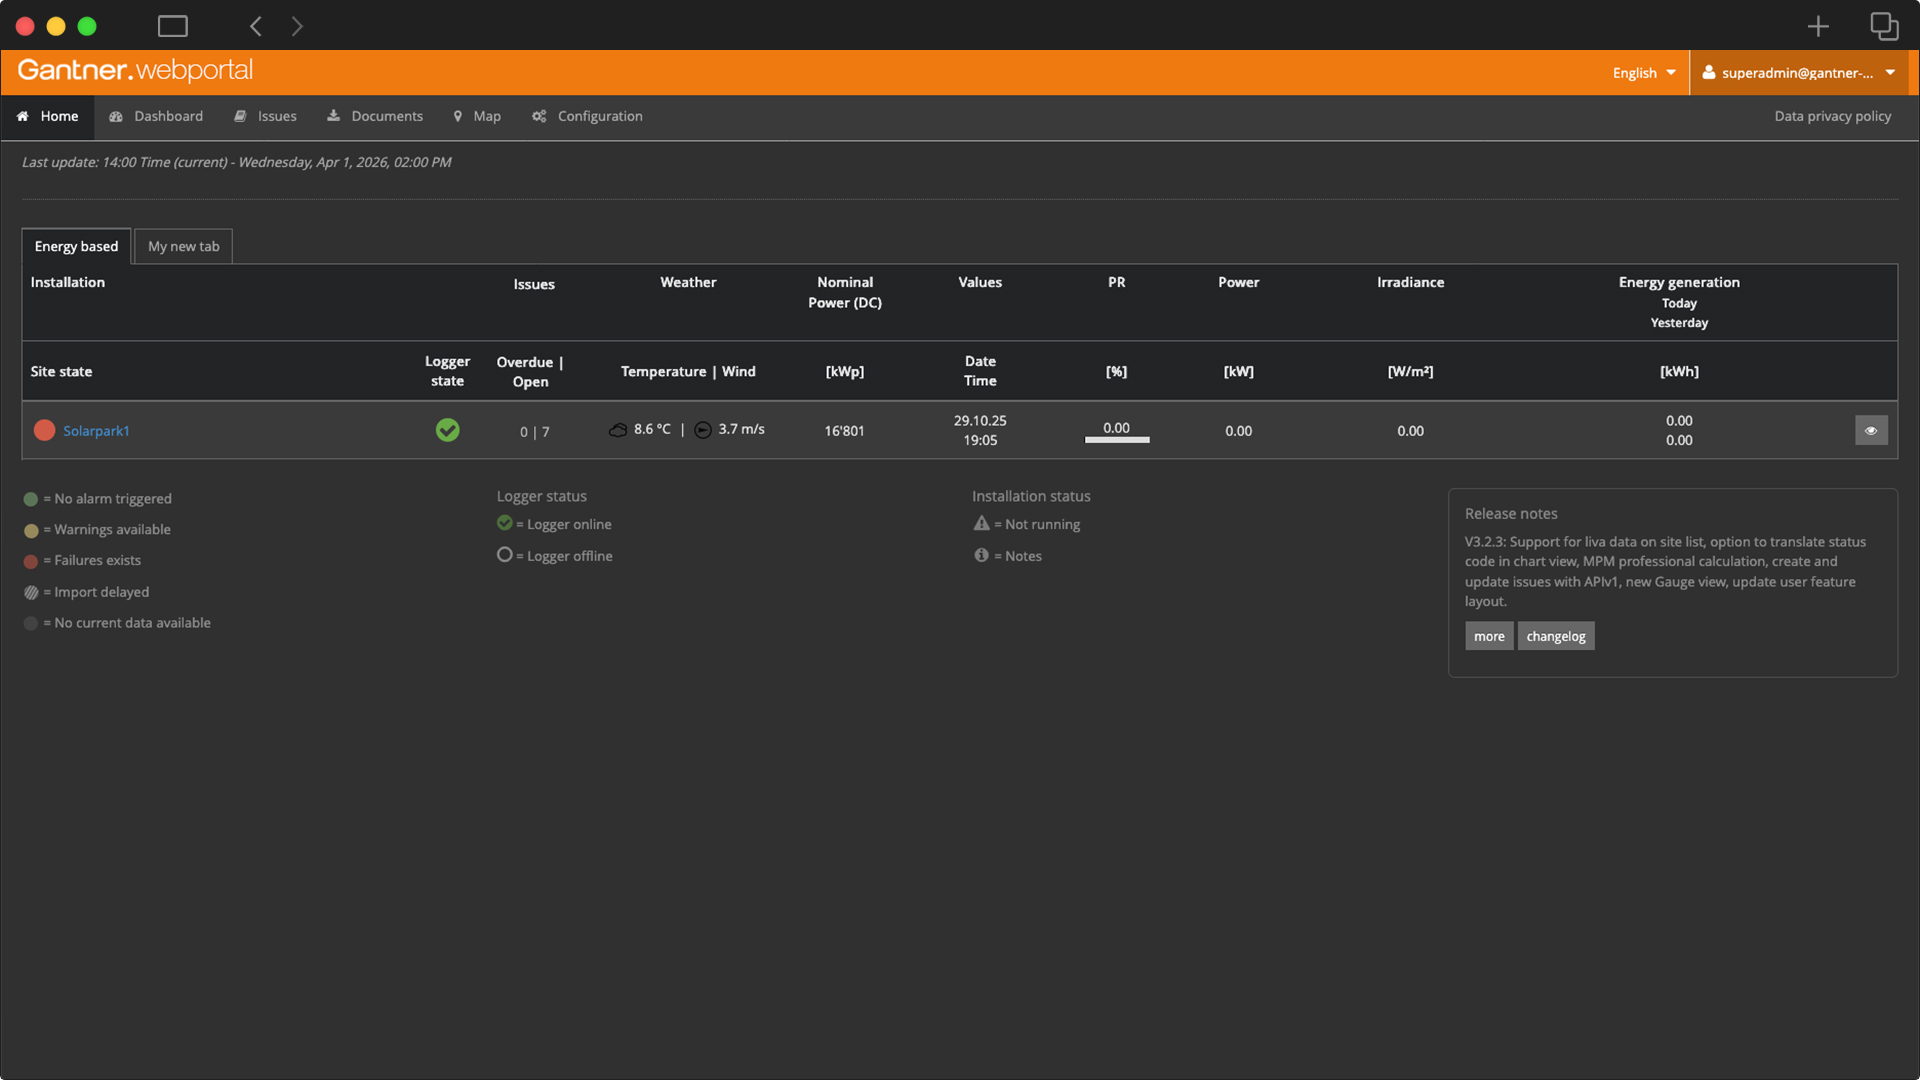
Traffic Light Status
Get an instant portfolio overview with intuitive status indicators
Automated Reporting
Generate professional, investor-ready reports in seconds, no manual efforts required
Full API Access
Integrate Gantner.IQX seamlessly with any third-party solution
How Gantner.IQX works
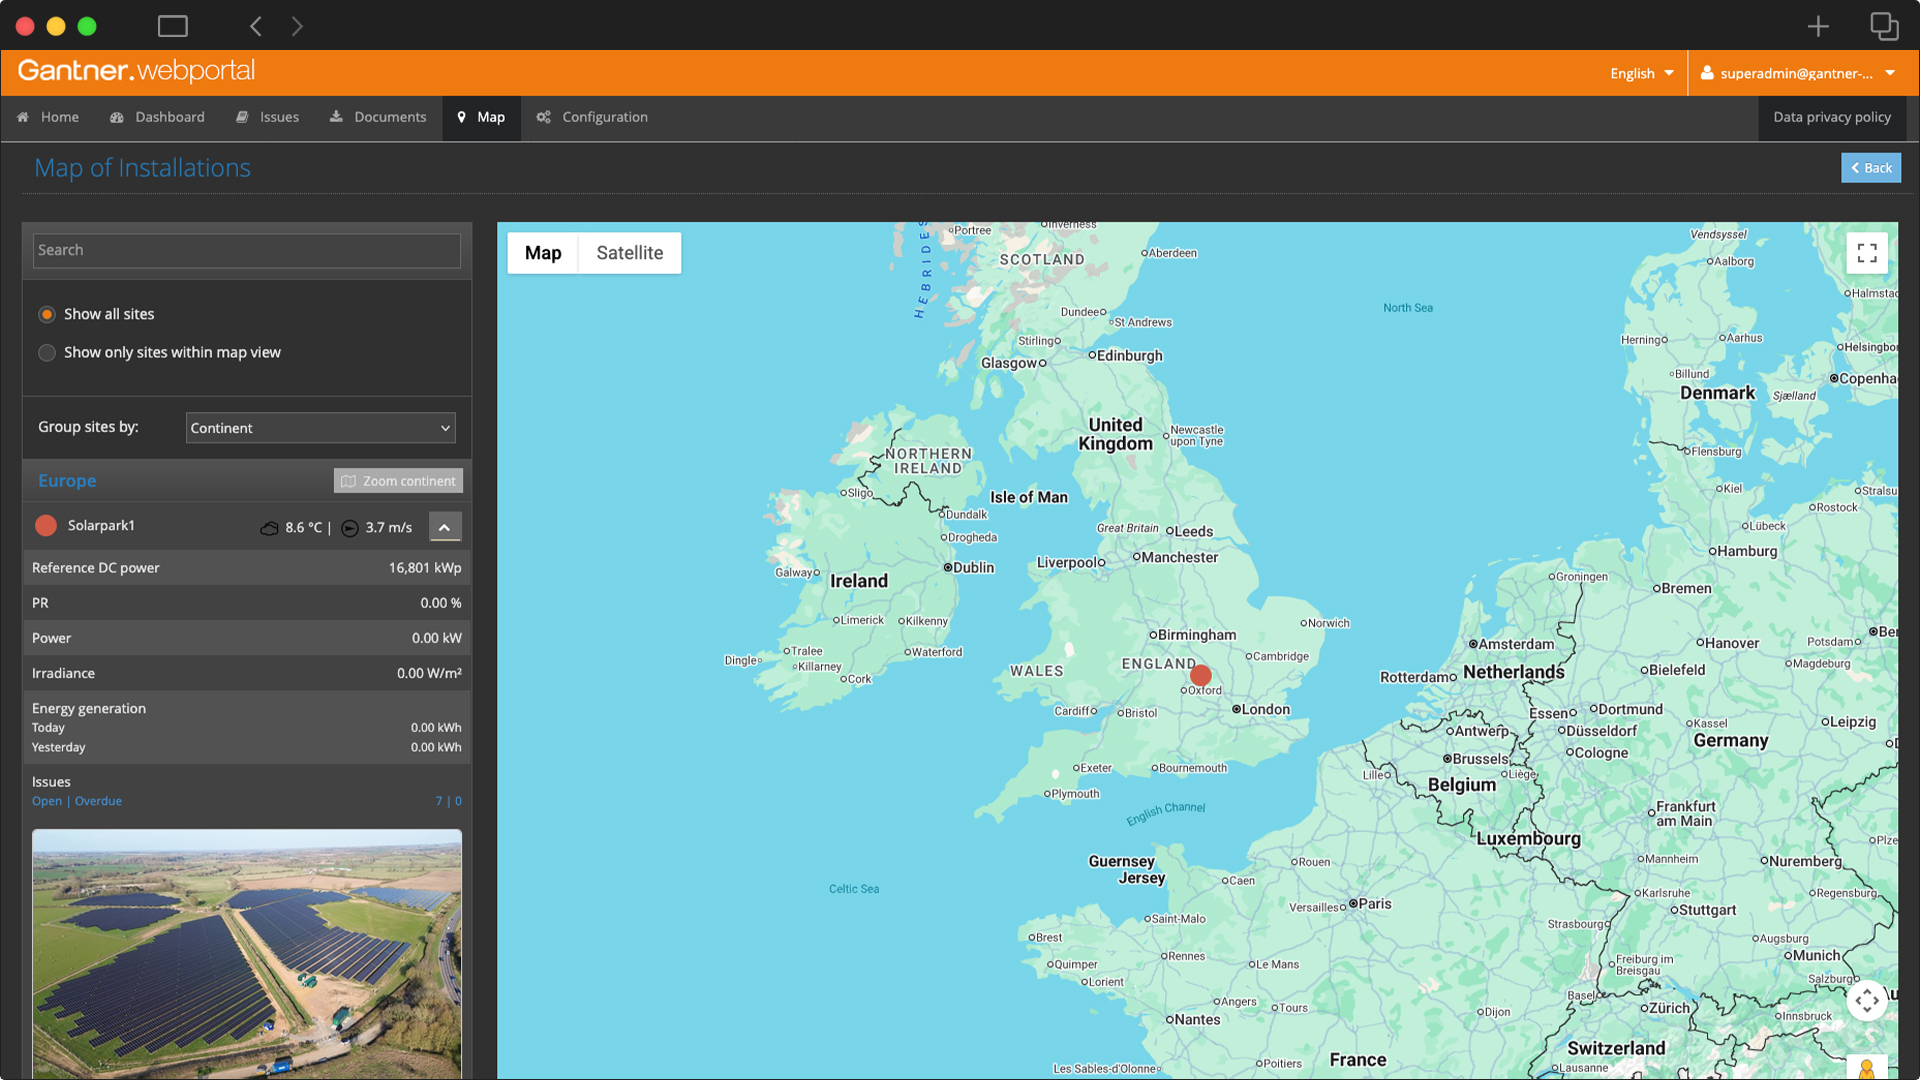
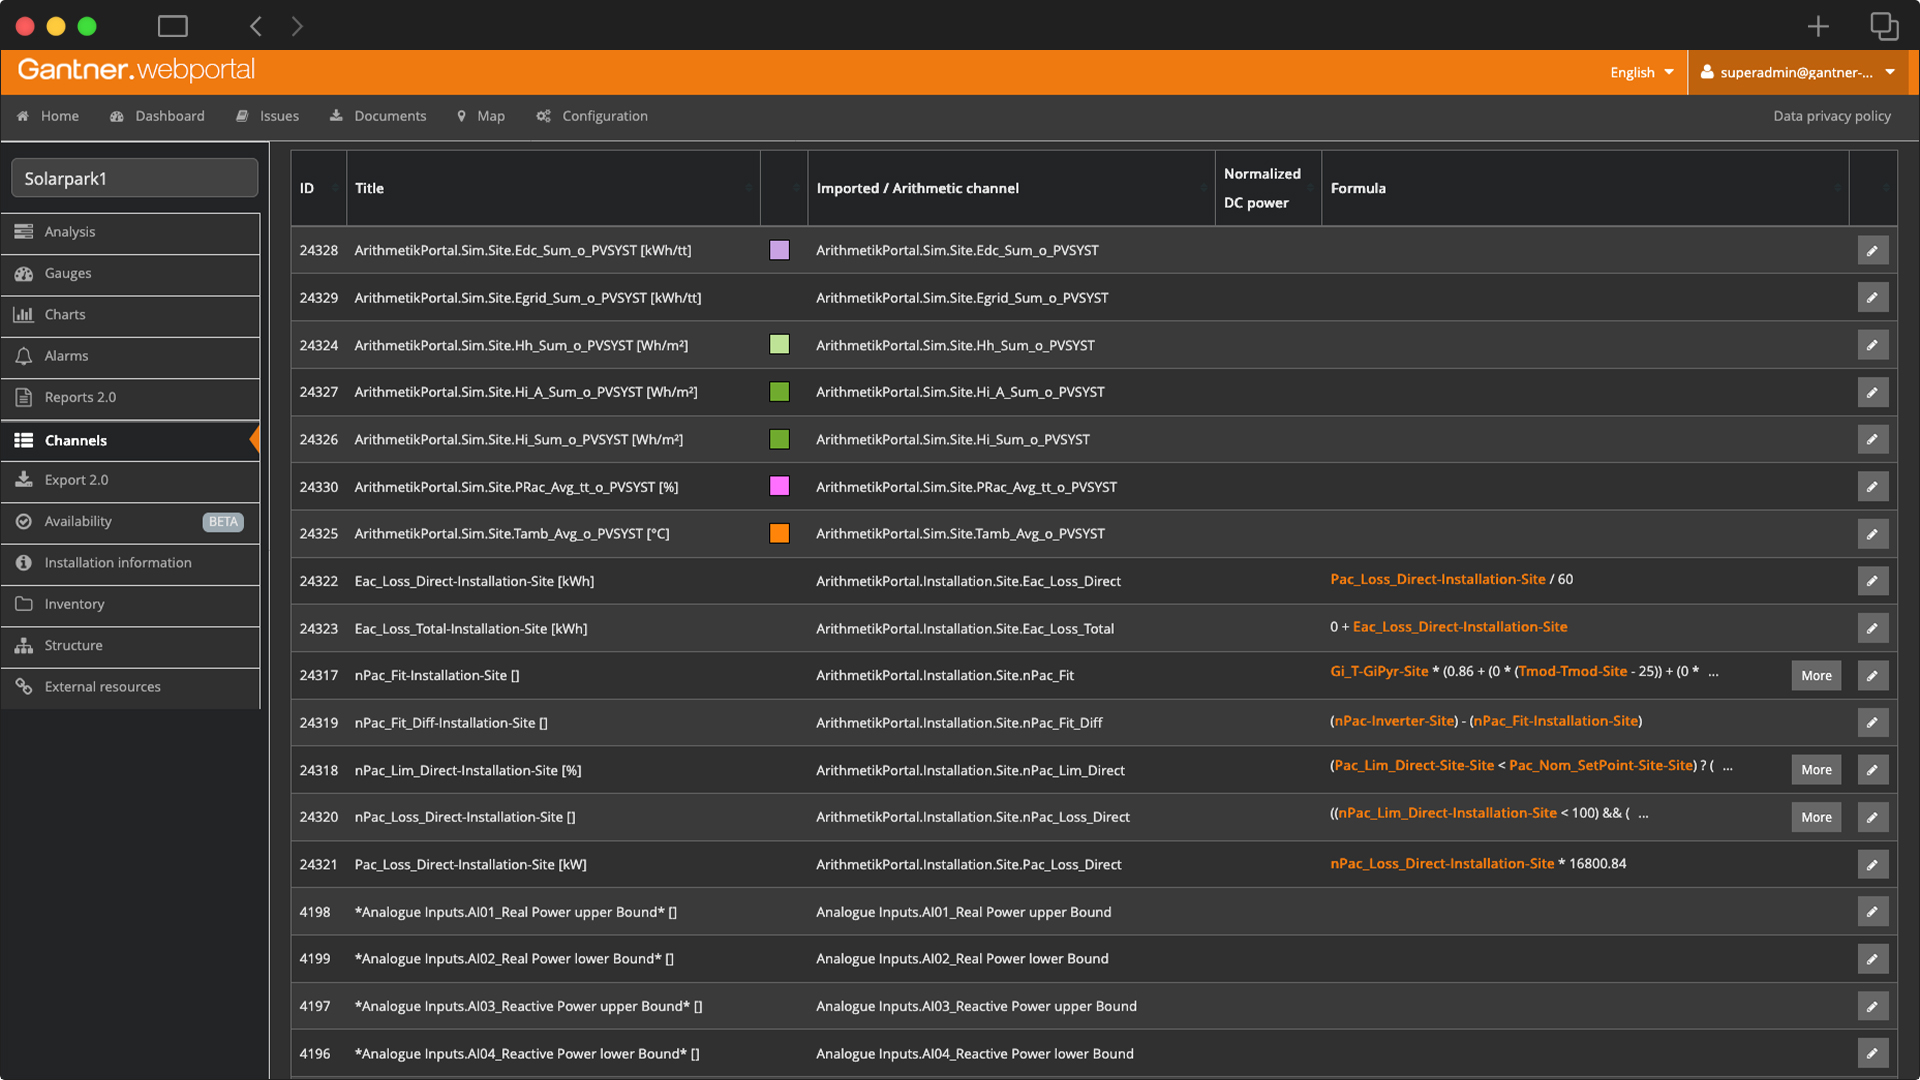
Gantner.IQX collects data from various sources such as data loggers, inverters and energy storage systems, consolidating it into a centralized platform. The system automatically processes, stores and structures this data, making it available for real-time monitoring and historical analysis.
Using advanced analytics and a digital twin based on mechanistic power models, the platform evaluates plant performance, identifies deviations and calculates key performance indicators. This enables operators and investors to gain deep insights into system behavior and optimize operational strategies.
Through dashboards, reports and APIs, users can visualize data, integrate it into external systems and manage entire portfolios efficiently. Automated workflows and alerting functions further support proactive operation and maintenance.
Advanced Analytics & KPIs

- Bankable Performance Ratio (PR)
- Contractual Availability vs. Energy Availability
- Guaranteed Yield Tracking
- Root Cause Analysis (RCA) & Loss Categorization
- Revenue-Weighted Energy Availability (RWEA)
- Opportunity Maintenance Window Index (OMWI)
- Real-time comparison of measured output against the digital twin (Gantner.MPM) to pinpoint power deviation as it happens
- Curtailment Impact Tracking
- BESS Round-Trip Efficiency (RTE)
- Battery State of Health (SoH)
Take a look
Platform Capabilities
- Portfolio & System Overview: Instant fleet status via traffic-light indicators
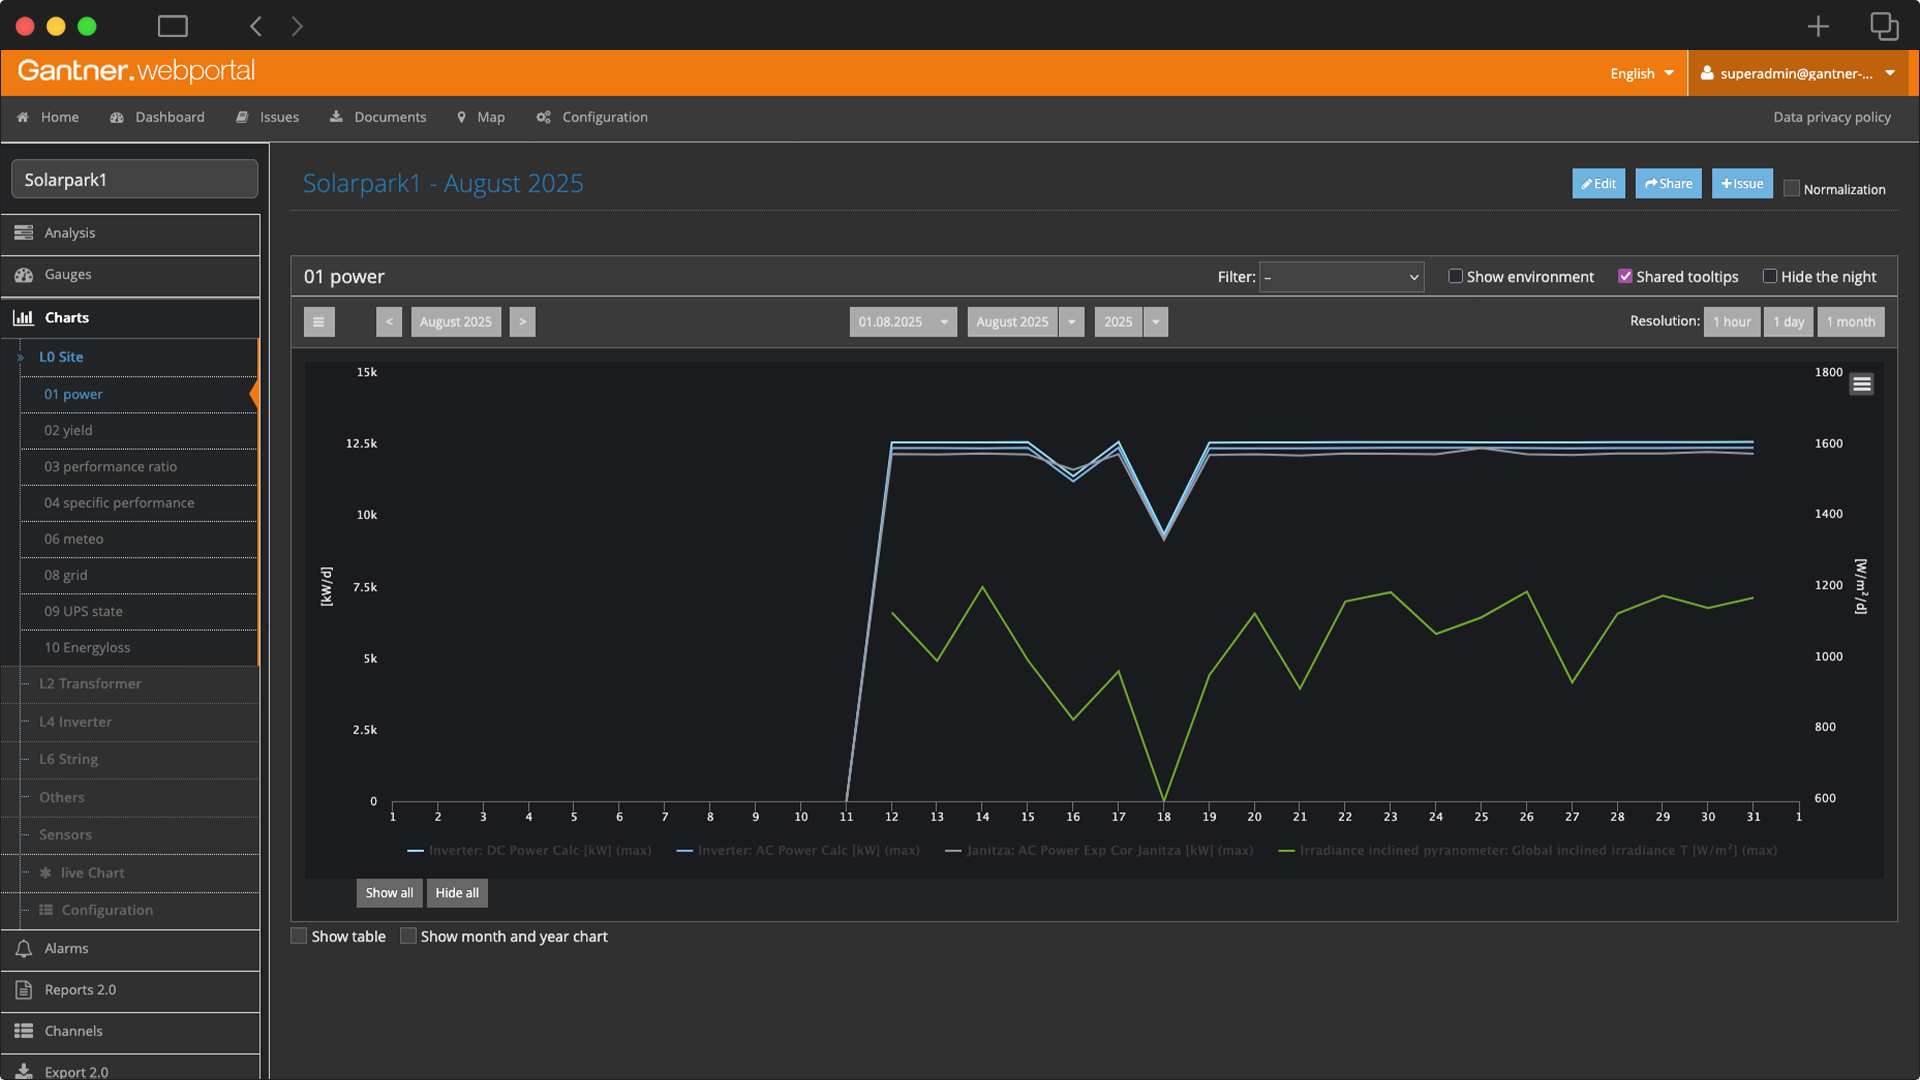
- Custom Diagrams: 100% user-configurable charts tailored to your needs
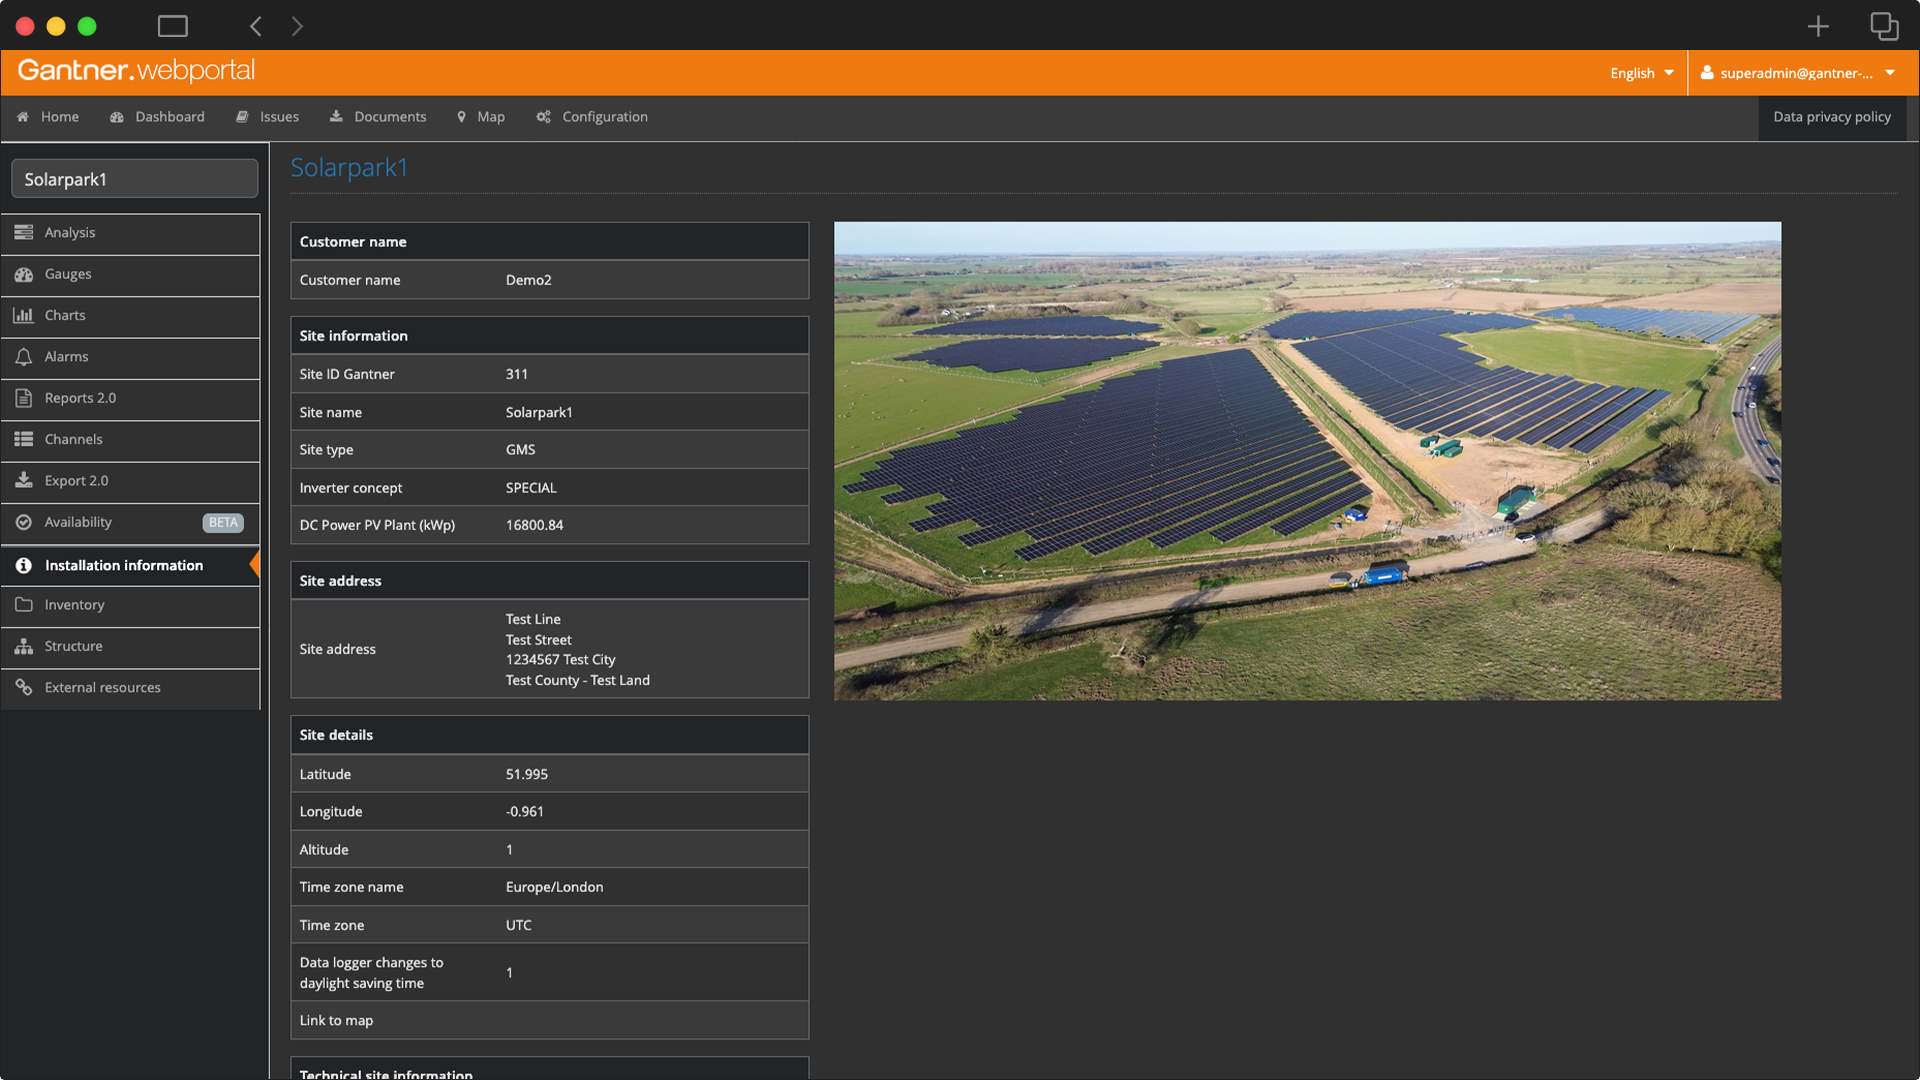
- PV Plant Structure: Hierarchical visual mapping of all plant components
- Technical & Financial KPIs: High-level tracking of yields and performance parameters
- Contractual Availability Calculation: Automated tracking and modeling for guaranteed-uptime KPIs
- Technical Performance Analysis: In-depth evaluation tools for operational engineering data
- Component & Signal Tracking: Signal monitoring for custom analysis and component warranty verification
- High-Resolution Data Storage: Sampling down to 1-minute resolution for precise metrics
- Normalized Values & Standard Reports: Ready-made reporting for cross-plant benchmarking
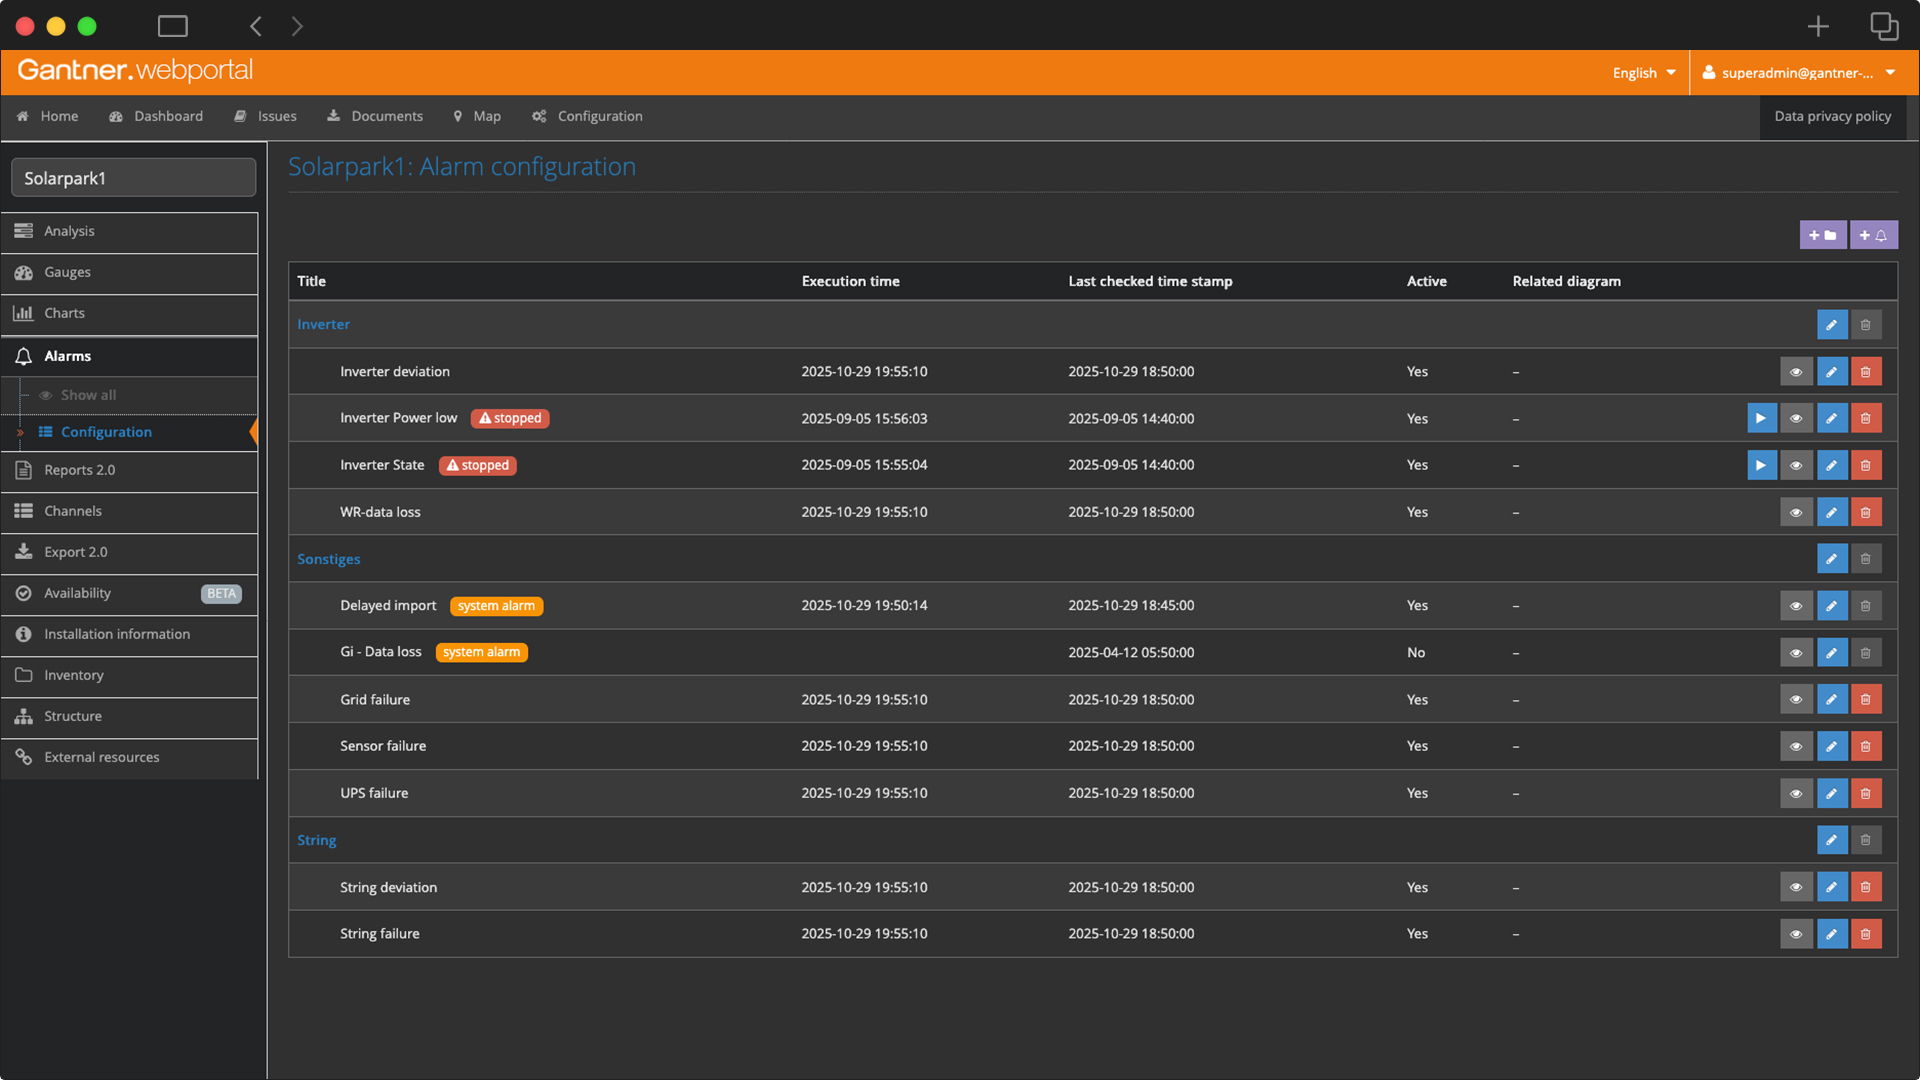
- Advanced Alarm Management: Supervision, automated classification and action triggering
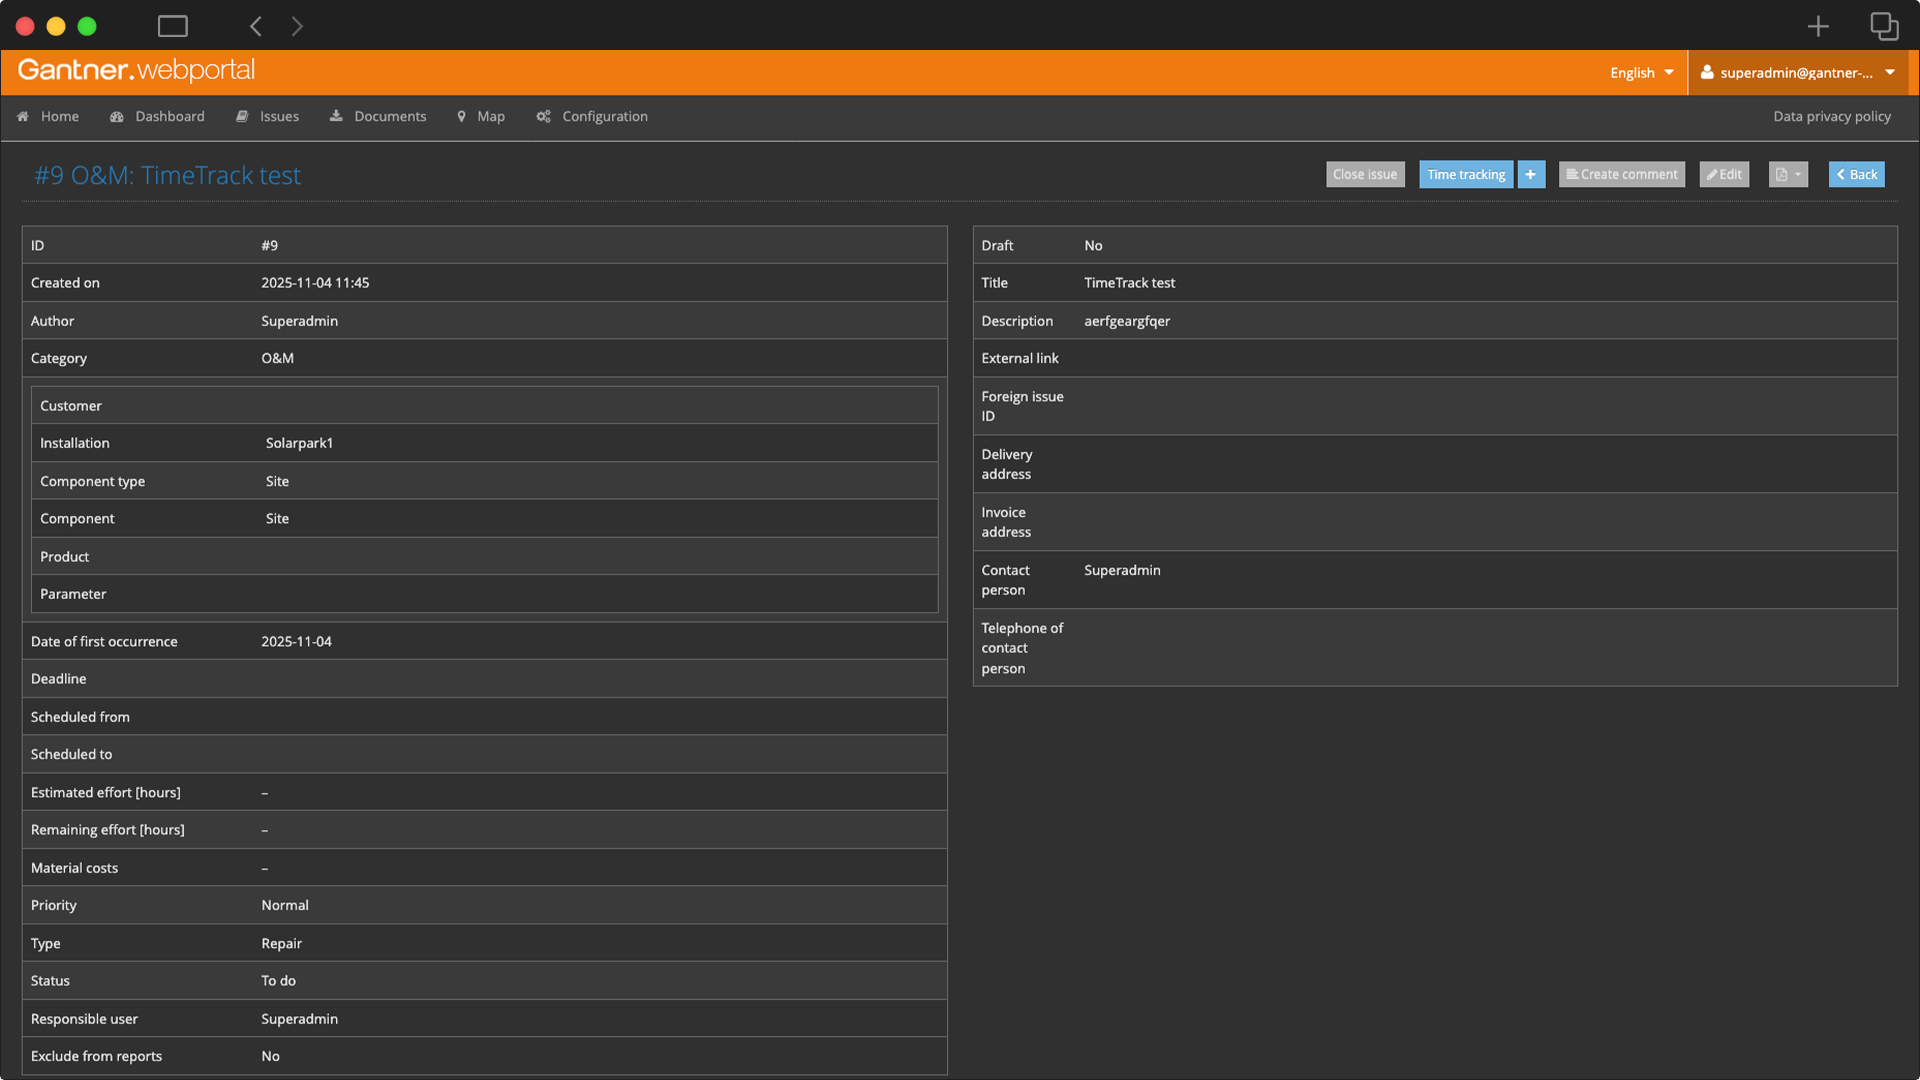
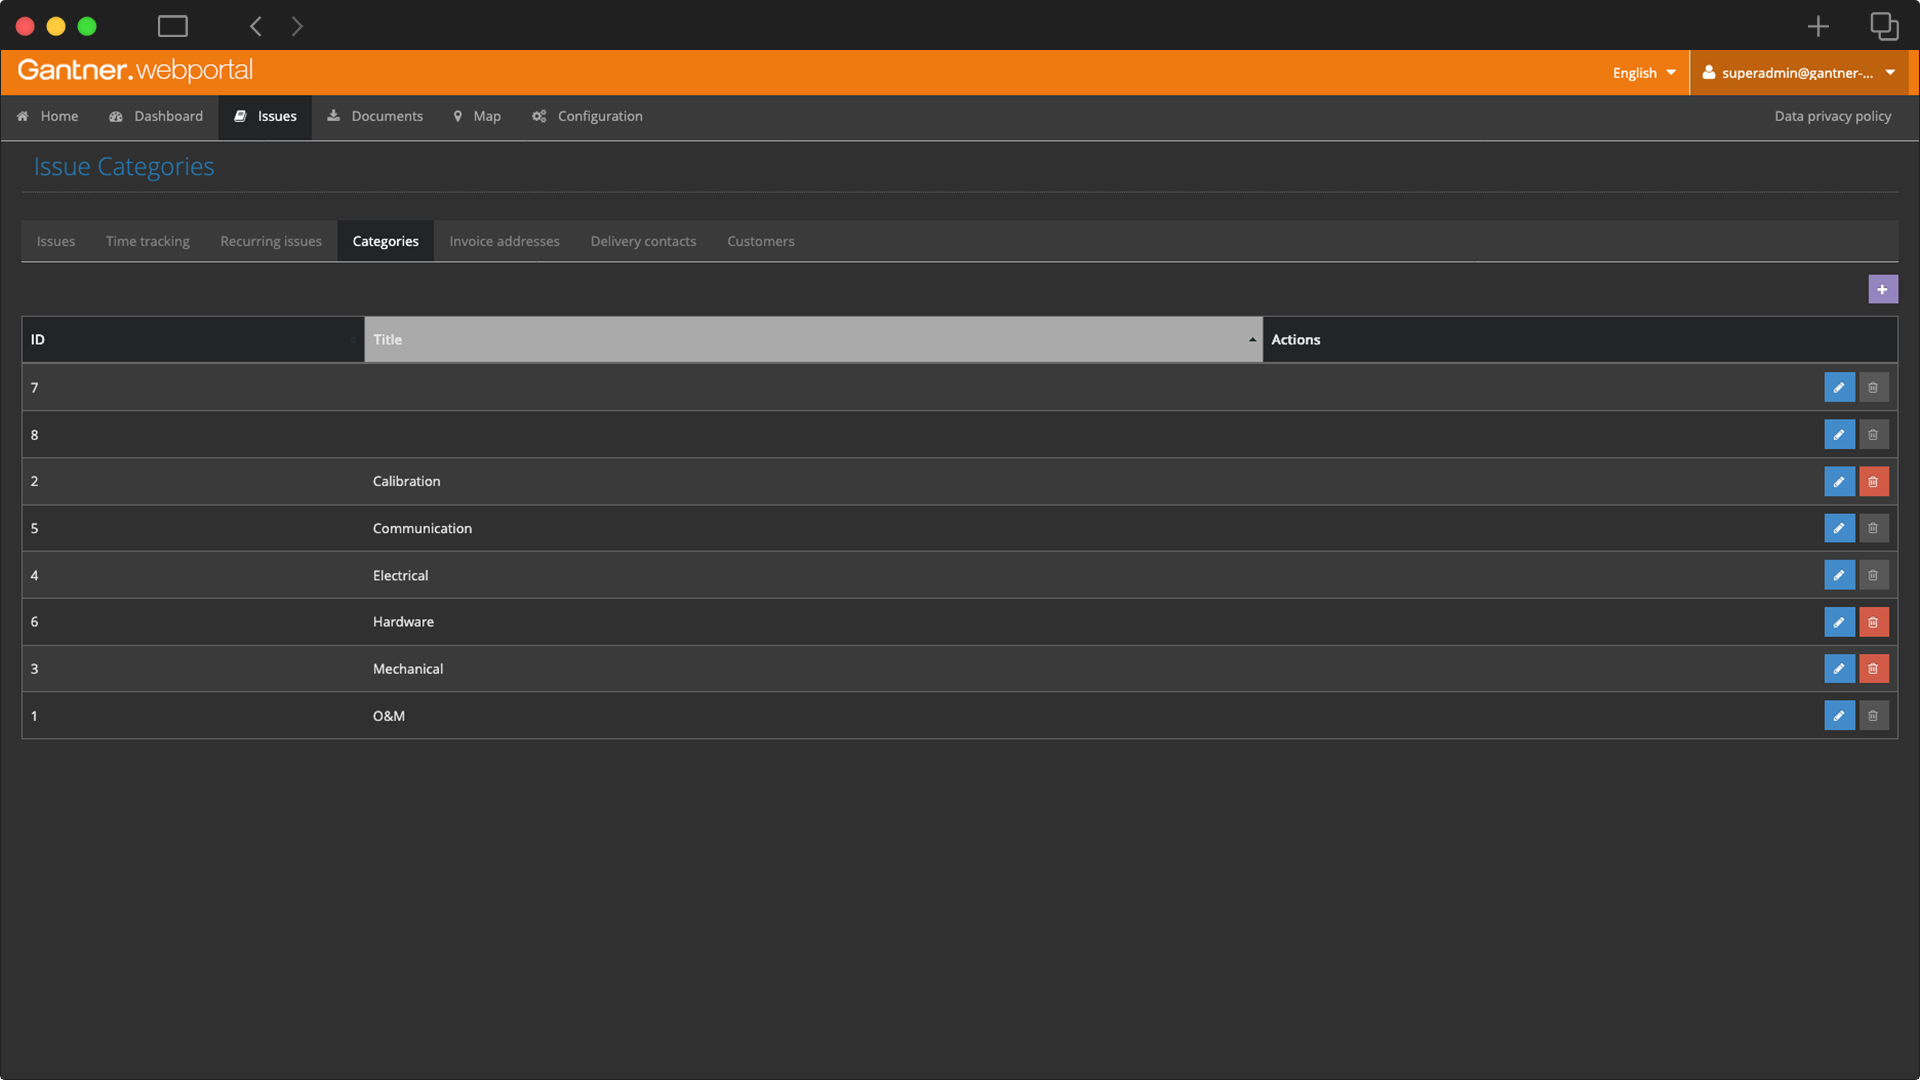
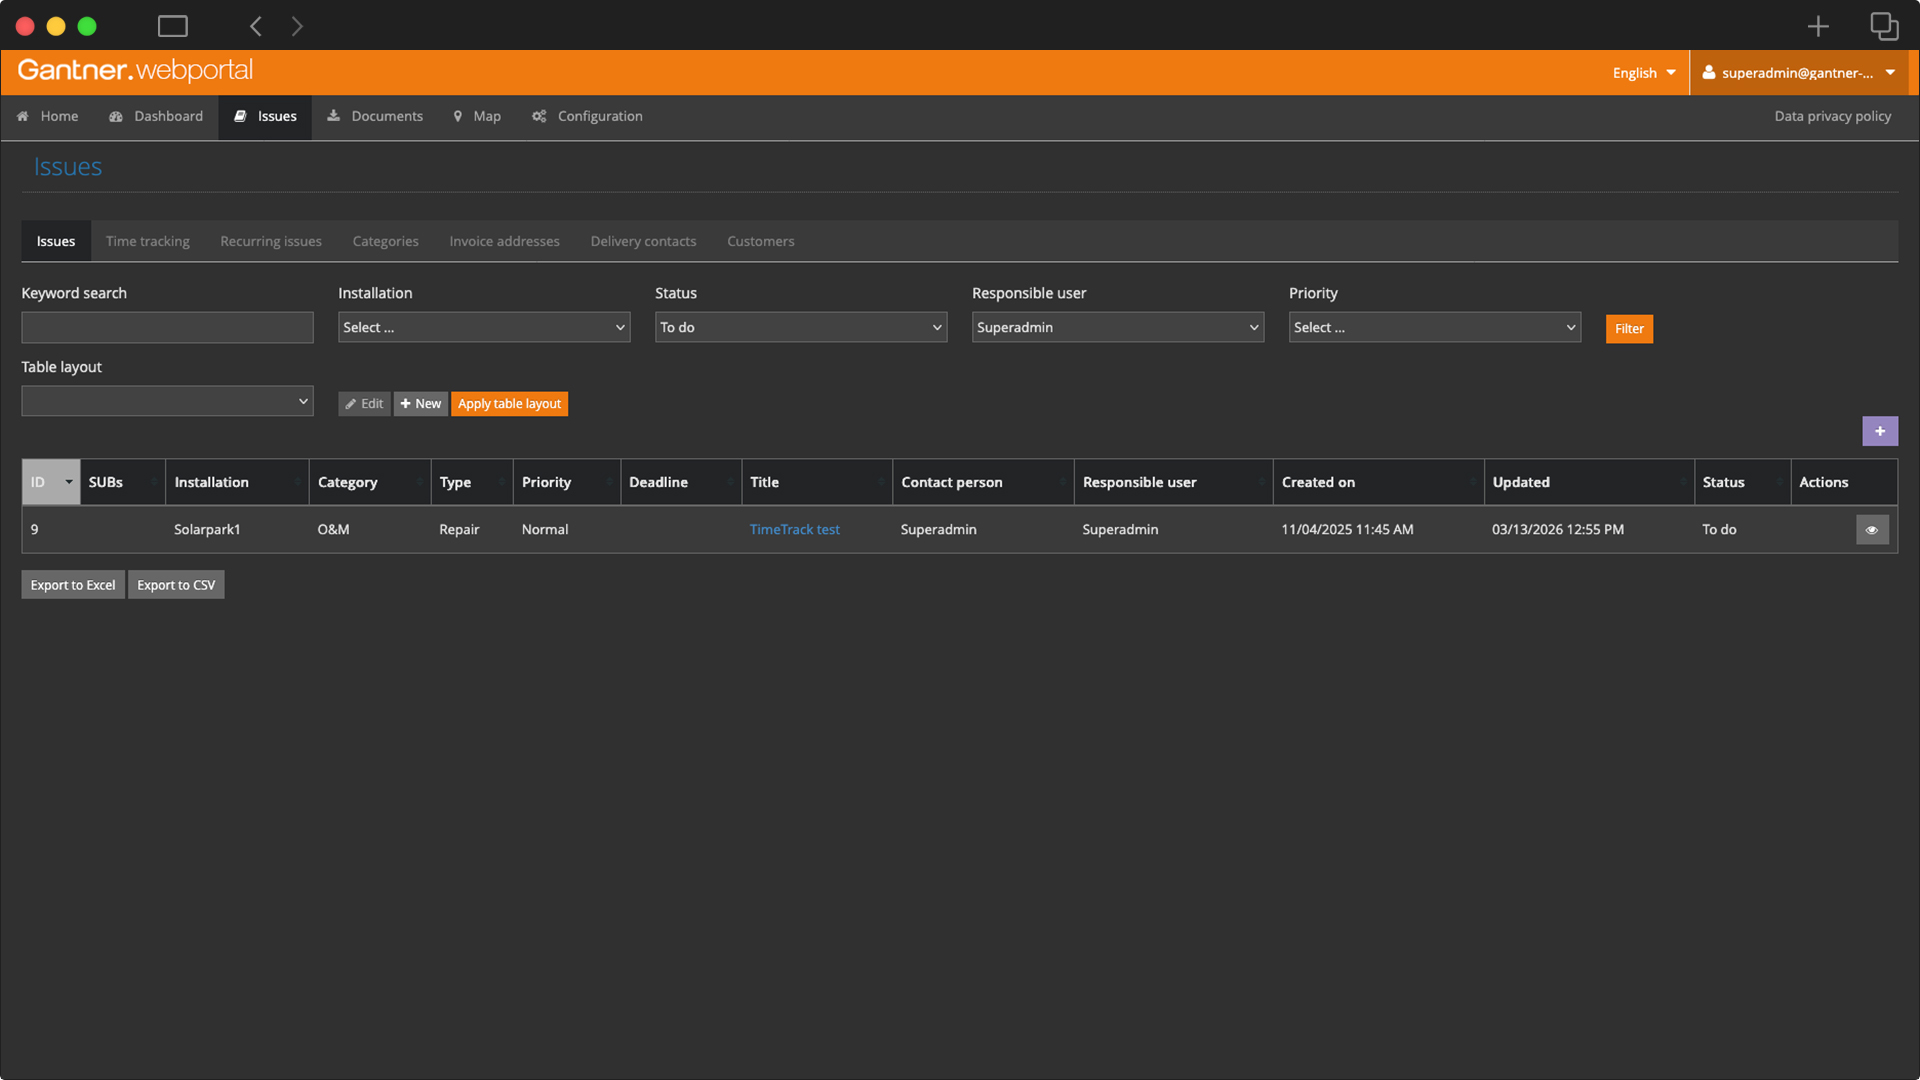
- Issue & Geo-Tracking System: End-to-end ticketing integrated with geographic positioning
- Plant Auditing & Protocols: Standardized inspection checklists and technical protocol routines
- Grid & Asset Control: Grid-operator curtailment logging and asset inventory management
- Multi-Vendor Compatibility: Hardware-agnostic integration with third-party loggers and data sources
- IEC 61724 Compliance: Full adherence to international standards for PV system performance monitoring
- Open API: Seamless software integration and flexible raw-channel data export
- User Management: Granular access control, custom profiles and rights management
- Modern Infrastructure: Pure W3C HTML5 web standard, 100% plug-in-free architecture
- Global Ready: Native multi-language support (English, German, Spanish)
- Real-Time Market Integration & Yield Optimization: Live spot-market price tracking to monetize actual energy yield, quantify the financial impact of downtime and faults, and maximize revenue strategy
- Production Nowcasting & Forecasting: Advanced predictive models for real-time and future energy generation
- Mechanistic Power Model (Gantner.MPM): Digital twin technology for real-time plant simulation and loss breakdown
- Automated Custom Reports: Scheduled, client-tailored report delivery based on bespoke profiles

Each solution is powered by perfectly aligned Gantner products – discover how our portfolio connects into integrated, high-performance systems.
Discover the Gantner solutionsDo you have questions about our products or need an offer?